IB经济考试形式以写作类题目为主,还有简答题。
一句话总结起来,就是不断写写写!很多人吐槽,IB考试全程下来,手都在颤抖。死记硬背对IB课本知识学习是很难奏效的,这是因为IB经济这门学科考试注重思维方法训练,需要学生将知识点串联起来,形成个人思维模式,再配以灵活运用。这就需要同学们平时不但要广泛涉猎,多多关注一些经济相关的新闻报告,多阅读相关的经济学书籍,比如《经济观察报》类报纸,培养经济思维与分析能力。同时学习中也要多加练习。学会把每一个知识点都理解透彻。
下面给大家整理了一些IB经济高分通过的经典例题,知识点梳理在下面了,快来练习起来吧。
今日知识点
Linear demand and supply functions
Demand
Qd=a-bP
Qd: quantity demanded, and is the dependent variable
P: price, independent variable
a: the Q-intercept (or the horizontal intercept)
-b: the slope, calculated as ΔQd/ΔP.
1. Example: Qd=14-2P
2. Changes in the parameter a and shifts of the demand curve
3. Changes in parameter -b and the steepness of the demand curve
Supply
Qs=c+dP
Qs: quantity supplied, and is the dependent variable
P: price, independent variable
c: the Q-intercept (or the horizontal intercept)
d: the slope calculated as ΔQs/ΔP.
1. Example: Qs=2+2P
2. Changes in the parameter a and shifts of the supply curve
3. Changes in parameter d and the steepness of the supply curve
Using linear equations to calculate and illustrate market equilibrium
Qd = Qs (at market equilibrium)
Using the third equation, we can eliminate Qs and Qd, and solve for P:
14 – 2P = 2 + 2P ⇒ 12 = 4P ⇒ P = $3
Substituting P into the demand equation, we have:
Qd = 14 – 2(3) ⇒ Qd = 14 – 6 = 8 units
Therefore, the equilibrium price is $3 and the equilibrium quantity is 8,
01例题
(a) Outline the reason why the coefficient of price in the supply function above is positive.
(b) Calculate the equilibrium price and the equilibrium quantity in this market.
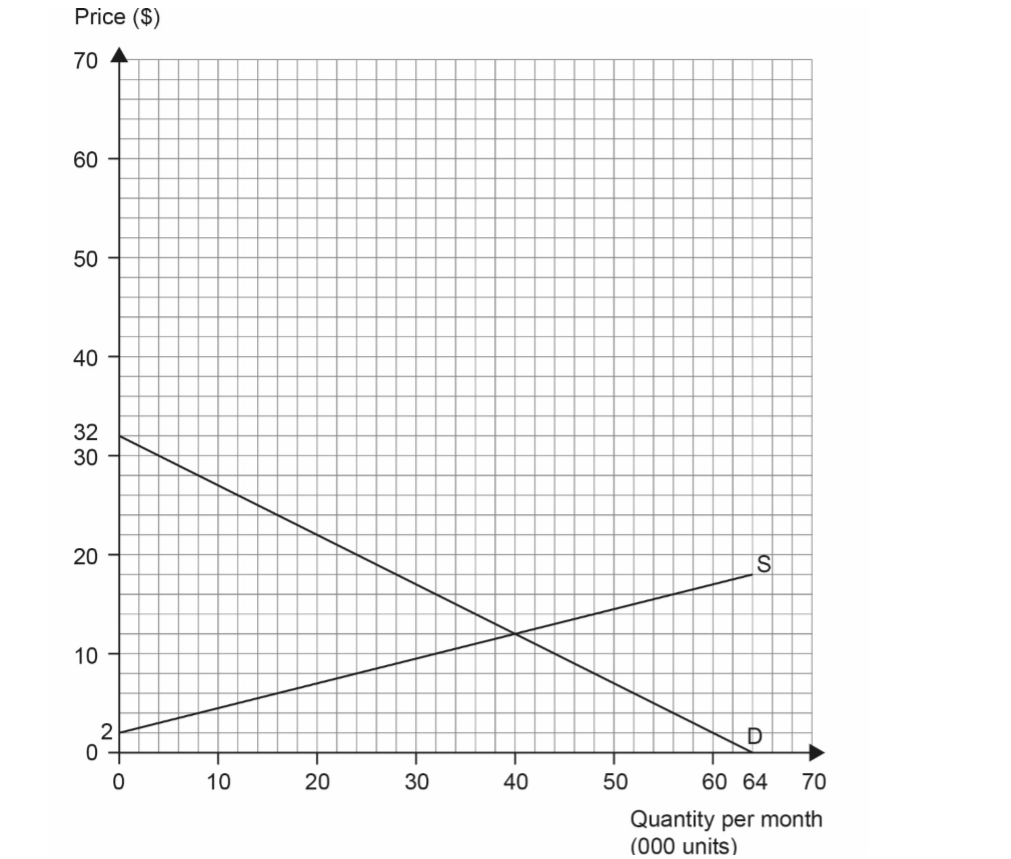
(c) Using the functions, plot the following in the grid below:
(i) a fully labelled market demand curve.
(ii) a fully labelled market supply curve.
02答案及详解
(a) Outline the reason why the coefficient of price in the supply function above is positive.
At higher prices, quantities supplied are greater since the profit margins of firms are higher (or reference to the idea that marginal costs are likely to increase as output increases or another valid incentive such as to gain more revenue)
(b) Calculate the equilibrium price and the equilibrium quantity in this market.
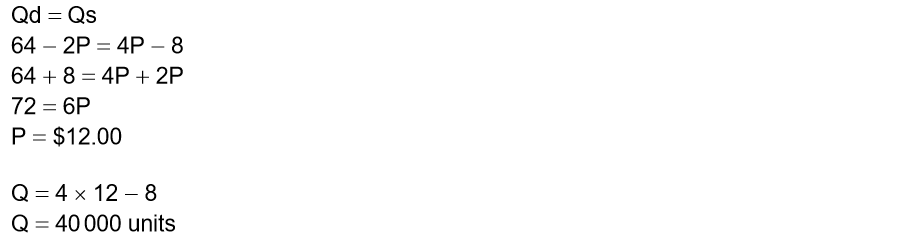
(c) Using the functions, plot the following in the grid below:
你的正确率怎么样呢?下面我们为大家准备了一道同类型的题目,请大家一起来试试解答
03真题演练
The following diagram illustrates the weekly demand for sunglasses in the town of Picton.
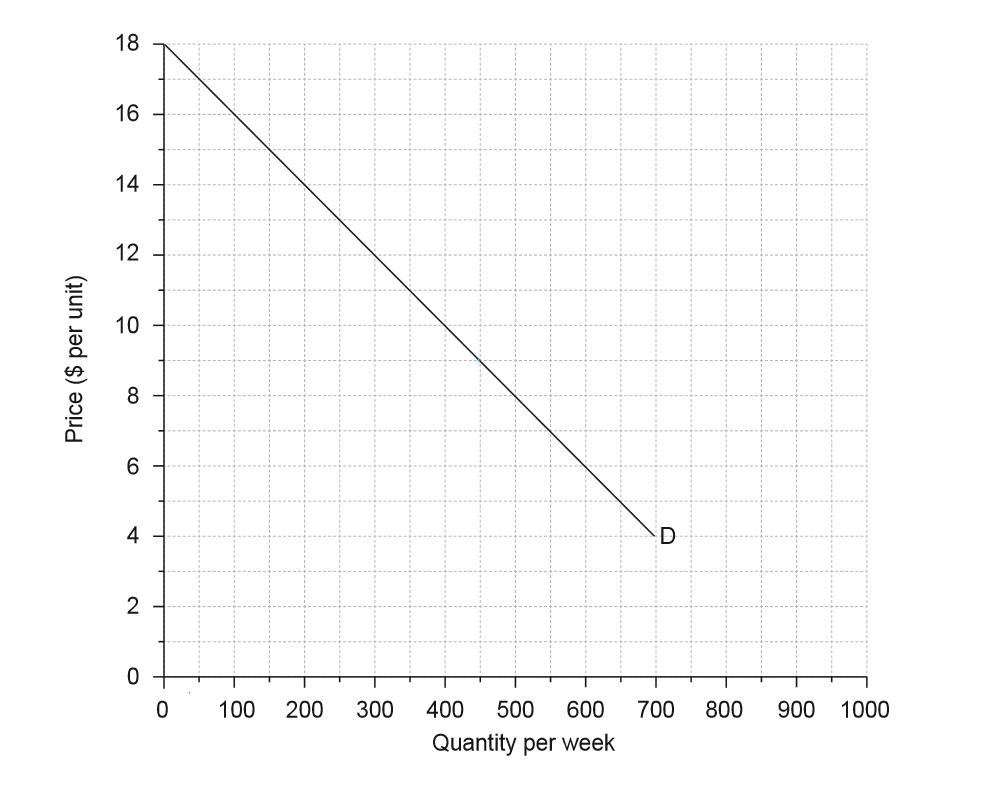
The market supply and demand for sunglasses in Picton is given by the equation
Qs = – 450 + 100P
Qd = 900 - 50P
where Qs is the quantity supplied per week, Qd is the quantity demanded per week and P is
(i) On the diagram, plot and label the supply curve for sunglasses in Picton.
(ii) Calculate the equilibrium price and quantity.